
Rainier Fruit Company’s David Armenta Discusses Apple Market Update
From
| 16 February 2022

Overview of apples supplies in the U.S. market, complemented by charts from Agronometrics. Original published on February 15, 2022.
SELAH, WA – The apple of my eye; an apple a day; not far from the apple tree—these phrases prove that apples are a staple fruit in the everyday lives of consumers. The category lends itself well to year-round availability, meaning there is always something new to report. I linked up with Rainier Fruit Company’s David Armenta, Sales Manager, to hear how the apple market is looking mid-February.
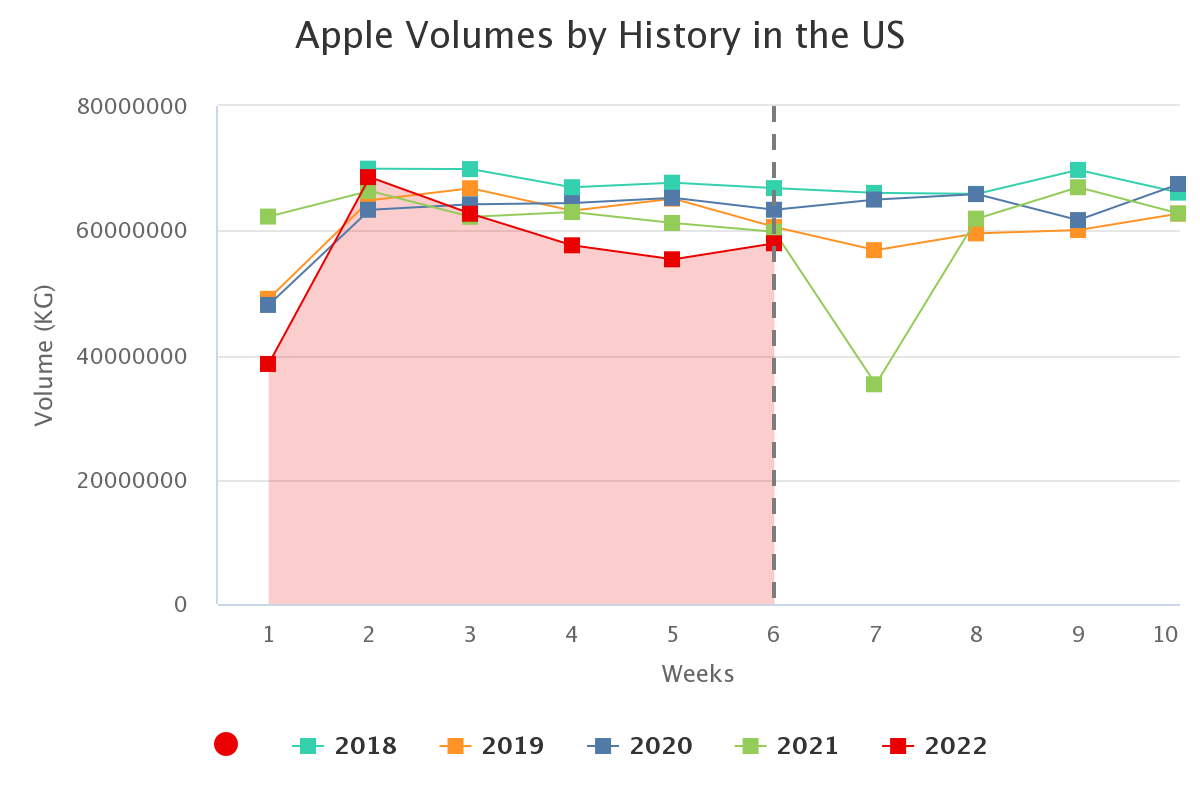
Source: USDA Market News via Agronometrics.
(Agronometrics users can view this chart with live updates here)
“The extreme heat during the growing cycle and decreased volumes for early harvest varieties such as Gala, Fuji, and Honeycrisp are pushing pricing up. However, due to ideal weather through the middle and later harvest windows, the heat had less of an impact. Varieties such as Pink Lady®, Envy™, and Cosmic Crisp® have increased volumes and are showing very good color, quality, and condition. More importantly, the flavor of these varieties is outstanding!” David told me.
He continued by noting how inflation has impacted the grower.
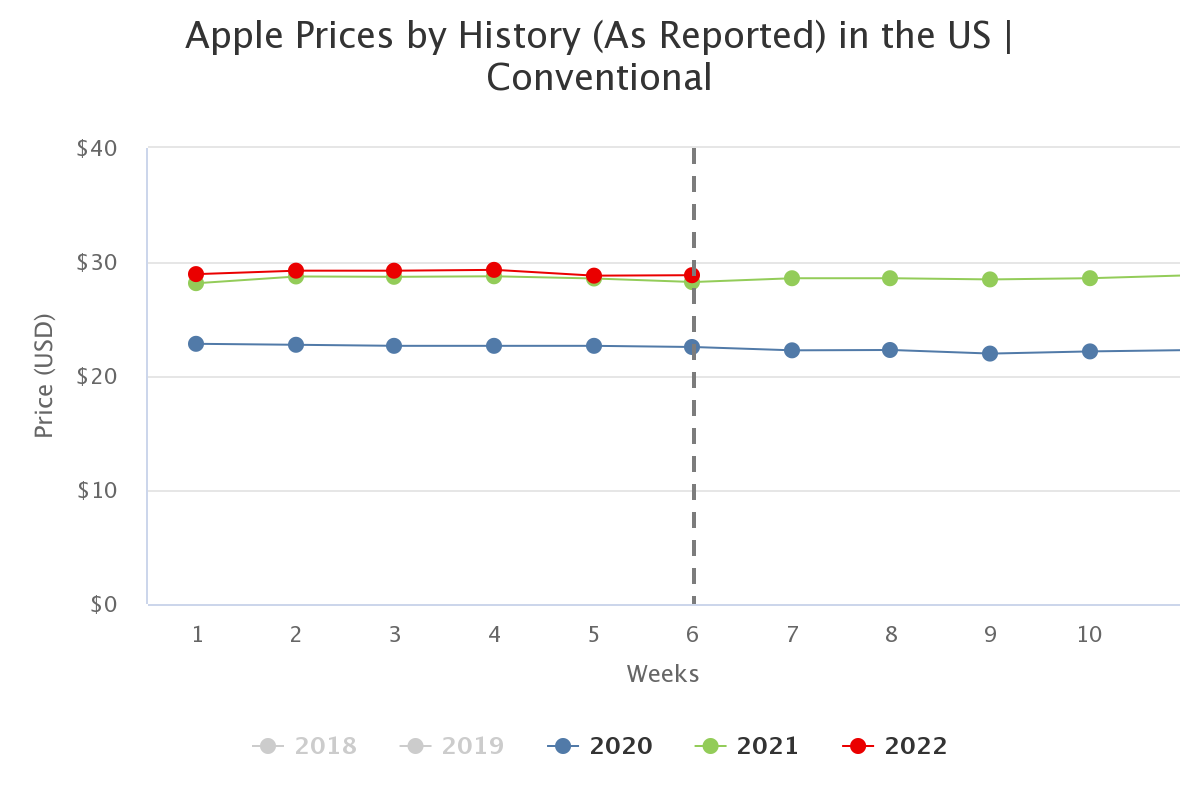
Source: USDA Market News via Agronometrics.
(Agronometrics users can view this chart with live updates here)
“With rising inflation in the spotlight, we are all experiencing rising costs on the retail grocery shelves. The produce department has witnessed some of the slowest rates of increase, providing an opportunity for consumers to branch out of their comfort zones in search of exceptional flavors and eating experiences,” said David.
With increased volumes for later-harvested varieties and outstanding flavor profiles, retailers can continue to diversify their apple offerings with promotions to entice consumers to try something new. This will keep the category fresh and exciting.
The News in Charts is a collection of stories from the industry complemented by charts from Agronometrics to help better tell their story.
Access the original article with this (Link)


