Bananas in Charts: U.S. market supplies hit five-year low
By
| 30 April 2019
Over the last few months, numerous weather-related issues have affected banana production in Central and South America.
The El Niño phenomenon has led to droughts, high temperatures, and heavy rains, among other issues, mainly in Costa Rica, Guatemala, Honduras and Nicaragua.
In this In Charts article, we will look at how banana volumes have behaved in the U.S., both historically and over the last few weeks of this year.
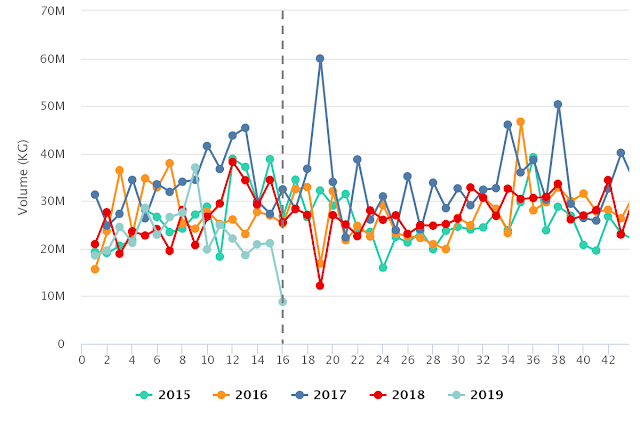
In the following chart you can see that current volumes in the market at a five-year low.
Historic volumes of bananas in the U.S. market
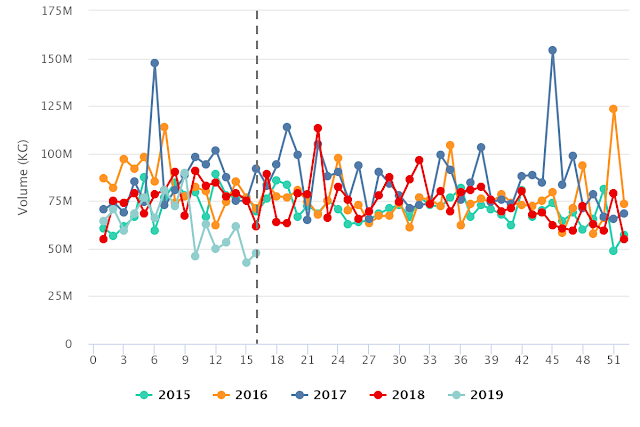
Source: USDA Market News via Agronometrics. (Agronometrics users can
view this chart with live updates here)
Most banana supplies in the U.S. come from Central and South America and the Caribbean, with Guatemala the country that has historically shipped the greatest volume to the market, followed by Costa Rica.
In the chart below you can get a sense of the historic volumes from the different origins over the last nine years.
Arrival volumes in the U.S. market, by origin
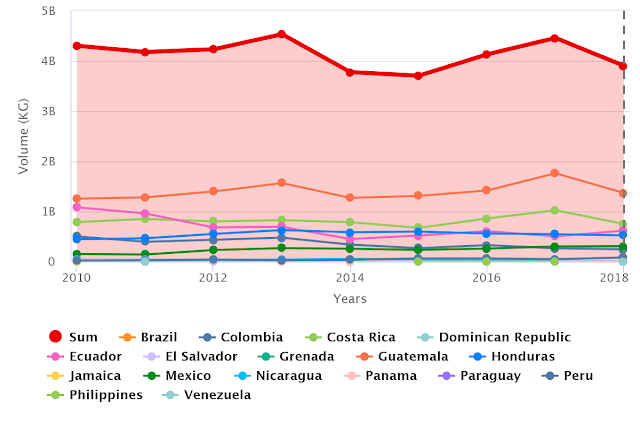
(Source: USDA Market News via Agronometrics. (Agronometrics users can
view this chart with live updates here)
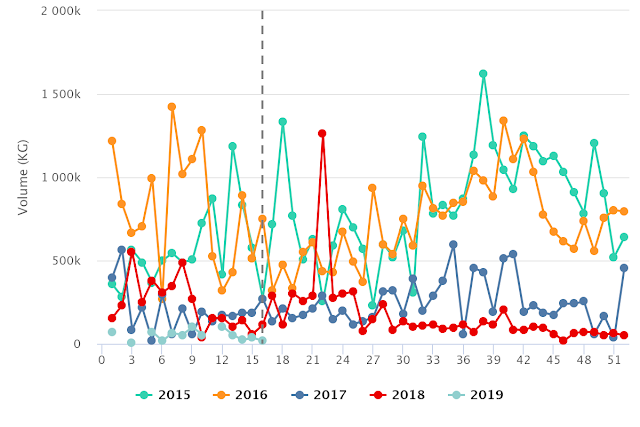
In the chart below you can see how volumes in the U.S. from Costa Rica specifically have behaved historically and so far this year.
Historic arrival volumes from Costa Rica in the U.S. market
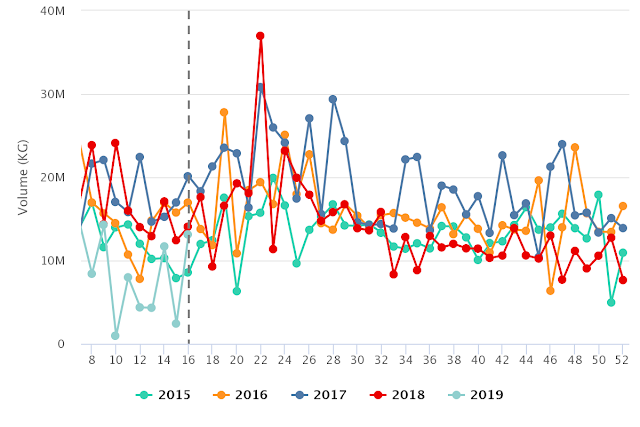
(Source: USDA Market News via Agronometrics. (Agronometrics users can
view this chart with live updates here)
Meanwhile, Guatemala has seen a particularly pronounced drop over the last four weeks, with volumes in week 16 much lower than what they have historically been around that time of the year.
Historic arrival volumes from Guatemala in the U.S. market
(Source: USDA Market News via Agronometrics. (Agronometrics users can
view this chart with live updates here)
Another heavily affected country is Nicaragua, which has already seen a substantial drop in volumes sent to the U.S. over the last five years.
According to local sources, the cause of this drop is largely related to the ongoing political crisis gripping the country, as well as lower competition with other suppliers.
Historic arrival volumes from Nicaragua in the U.S. market
(Source: USDA Market News via Agronometrics. (Agronometrics users can
view this chart with live updates here)
Written by: Cristian Crespo
Original published in FreshFruitPortal.com on April 30, 2019 (Link)
Related Stories