
Agronometrics in Charts: Peru Bent on Recovering Lost Ground for Asparagus Production
By
| 25 March 2022

In this installment of the ‘Agronometrics In Charts’ series, Sarah Ilyas evaluates the state of the asparagus market in Peru. Each week the series looks at a different horticultural commodity, focusing on a specific origin or topic visualizing the market factors that are driving change.
Asparagus production in Peru occurs in La Libertad valley in the North and Ica valley in the South. Both areas enjoy natural conditions that, in combination with adequate technology and requisite business acumen, have made Peru an esteemed asparagus exporter in the world. Currently, Peru is positioned as the second country with the highest yield per hectare planted. The asparagus plantations are grown in irrigated beds and can be forced into dormancy by virtue of droughts. Using this method of ‘forced dormancy’, production can be maintained year round and is coordinated to meet demand in export markets in a timely manner. This agricultural system offers Peru the highest yields seen across the globe at roughly twice the production per hectare of its competitors. Around half of the asparagus produced in Peru is green and sold fresh whilst the other half is white and sold in cans and jars. The United States is the primary destination of the Peruvian asparagus and only admits asparagus that is fumigated, which generates less added value. Additionally, cut- throat competition with Mexican asparagus strains Peru’s export values. From 2017 to 2021, Peruvian fresh asparagus exports burgeoned by 18.4% in volume, from 23,082,591 to 27,329,252 boxes (5 kilograms each box). In that same period, however, their FOB value decreased by 20%, going from 505,100,000 dollars to 404,048,452. The peak volumes recorded this season were around 13 K tonnes, a slump of roughly 10 percent compared to the previous season.
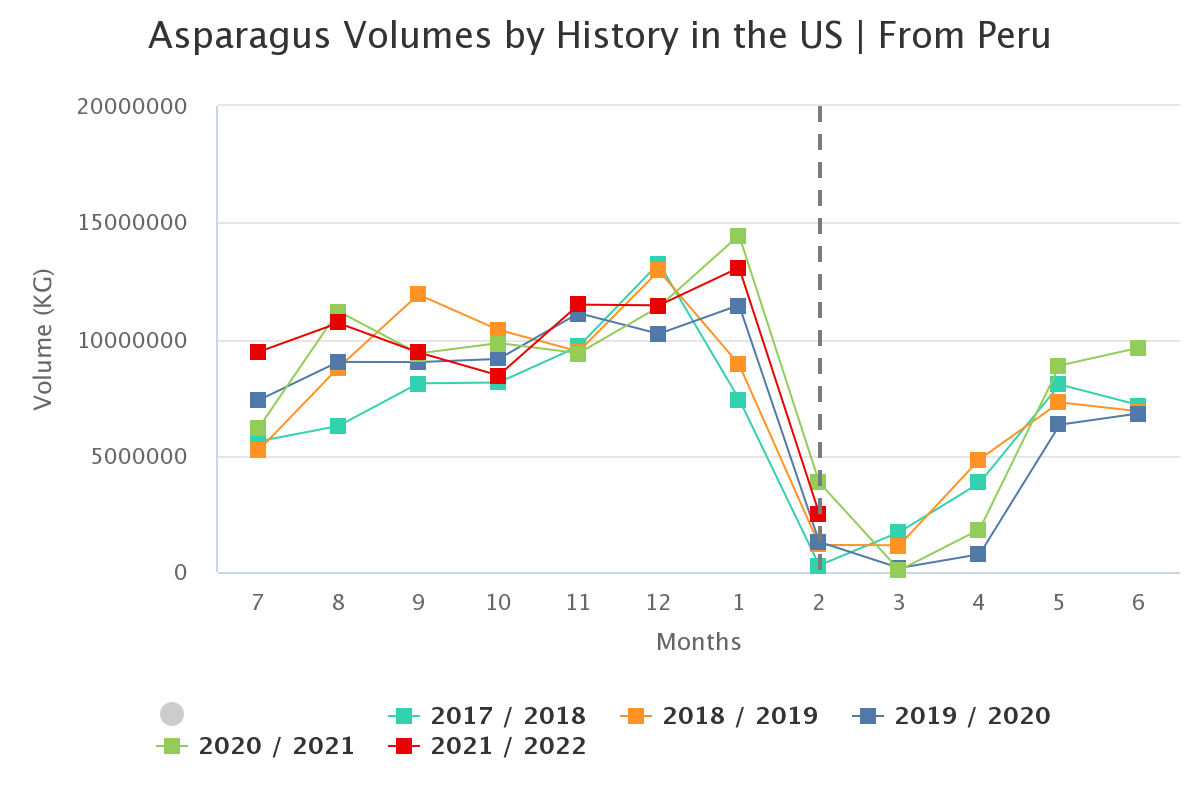
Source: USDA Market News via Agronometrics.
(Agronometrics users can view this chart with live updates here)
Average trending prices this season have been around $20- $23 per package. Despite the boost in volumes over the past half decade, the country has not yet reached the export levels it had prior to the pandemic and has been unable to patch up the gaping disparity that exists between Peruvian and Mexican asparagus exports. It is worthy to note that Mexico and Peru stand toe to toe only in the United States since it is the only destination for Mexican asparagus. In the US market, Mexico has a 65% share followed by Peru with a 34% share.
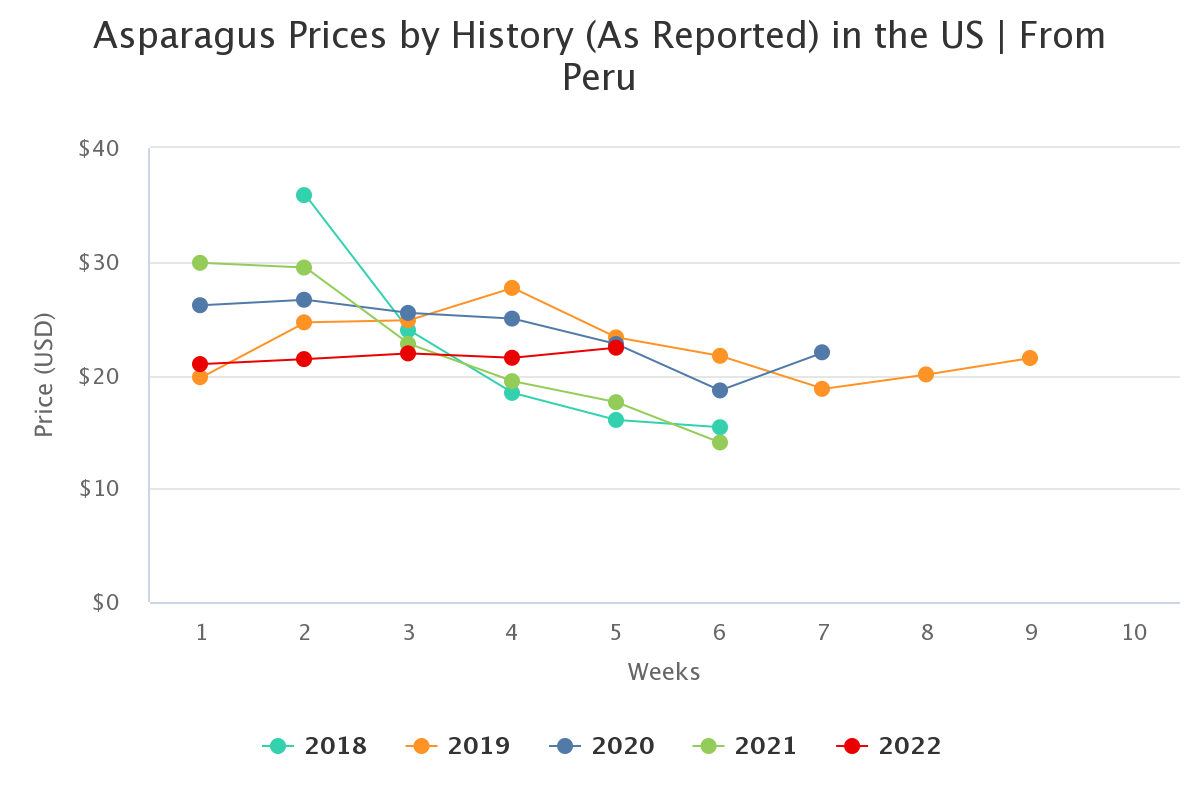
Source: USDA Market News via Agronometrics.
(Agronometrics users can view this chart with live updates here)
“Peruvian asparagus producers are determined to recover lost ground.” says IPEH president, Juan José Gal’Lino. He went on to claim that SENASA and the IPEH had requested the United States to waive fumigation as a requirement for Peru to export its asparagus to the US. “The possibility that fumigation will finally be suspended in the United States and the self-demand of having a phytosanitary certificate to export asparagus will not only make Peru recover the level of exports and recognized quality, but it can also open more markets if the logistical transport problem is solved”. While it is true that such leniencies could benefit Peru’s asparagus exports, Peru is still bogged down by issues such as labor constraints, hefty production costs, logistical difficulties and aging crops, the effects of which will be self-evident.
In our ‘In Charts’ series, we work to tell some of the stories that are moving the industry. Feel free to take a look at the other articles by clicking here.
All pricing for domestic US produce represents the spot market at Shipping Point (i.e. packing house/climate controlled warehouse, etc.). For imported fruit, the pricing data represents the spot market at Port of Entry.
You can keep track of the markets daily through Agronometrics, a data visualization tool built to help the industry make sense of the huge amounts of data that professionals need to access to make informed decisions. If you found the information and the charts from this article useful, feel free to visit us at www.agronometrics.com where you can easily access these same graphs, or explore the other 21 commodities we currently track.
Written by: Sarah Ilyas


