
Agronometrics in Charts: Mexico’s Grape Volumes Hitting The Mark
By
| 11 May 2022

In this installment of the ‘Agronometrics In Charts’ series, Sarah Ilyas studies the state of the Mexican grape market. Each week the series looks at a different horticultural commodity, focusing on a specific origin or topic visualizing the market factors that are driving change.
95% of the table grapes exported from Mexico to more than 30 countries around the world originate from Sonora, Mexico. Currently, the state of Sonora is capable of harvesting more than 25 million boxes of 8.2 kilograms; these are exported to the United States, Canada, Europe, South America and Asia. U.S. imports of Mexican table grapes started in mid-April this year, volumes are expected to pick up momentum significantly during the month of May. Growers are anticipating superior quality and higher volumes. “Our vineyards in Jalisco begin in April, which will be great for having fresh, flavorful crop at a time where South America is starting to wind down. But things for us will really kick in around the third and fourth weeks of May,” says Carlos Bon, vice president of sales for Divine Flavor LLC, Nogales, Ariz. Volumes in week 18 stood at around 4 K tonnes, depicting a significant surge compared to week 18 of 2021.
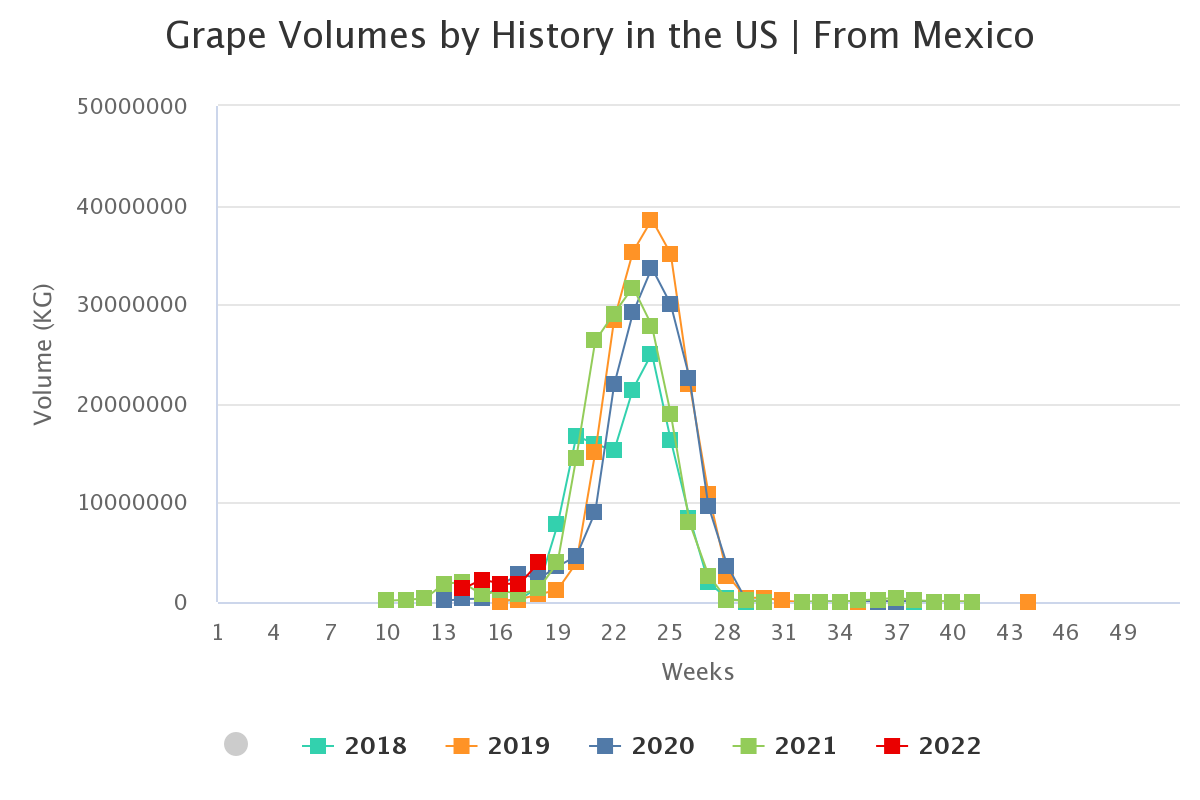
Source: USDA Market News via Agronometrics.
(Agronometrics users can view this chart with live updates here)
“Weather has been good, and we expect very good sizing and color this season,” says Howard Nager, director of marketing and business development at Los Angeles-based Pacific Trellis Fruit/Dulcinea Farms. Despite the cold weather conditions observed from mid to late April, the fruit remained unscathed. “From what I saw, I don’t think there is going to be any significant volume out of Sonora before May 15 or May 18, which is later than the dates when we used to start,” says Miguel Suarez, managing partner at Mas Melons & Grapes LLC. He attributed the later start of the season to the new grape varieties that are gathering acclaim. “The new varieties, by nature, are later varieties,” he added. “I really think that the whole grape industry in North America and South America will see a change in dates.” Ten years ago, the Sonora grape season would start the first week of May, Suarez said. Prices are expected to be lower compared to the previous season owing to the larger expected volumes. Last season saw prices starting at $37.26 per package before settling to $14.08 per package.
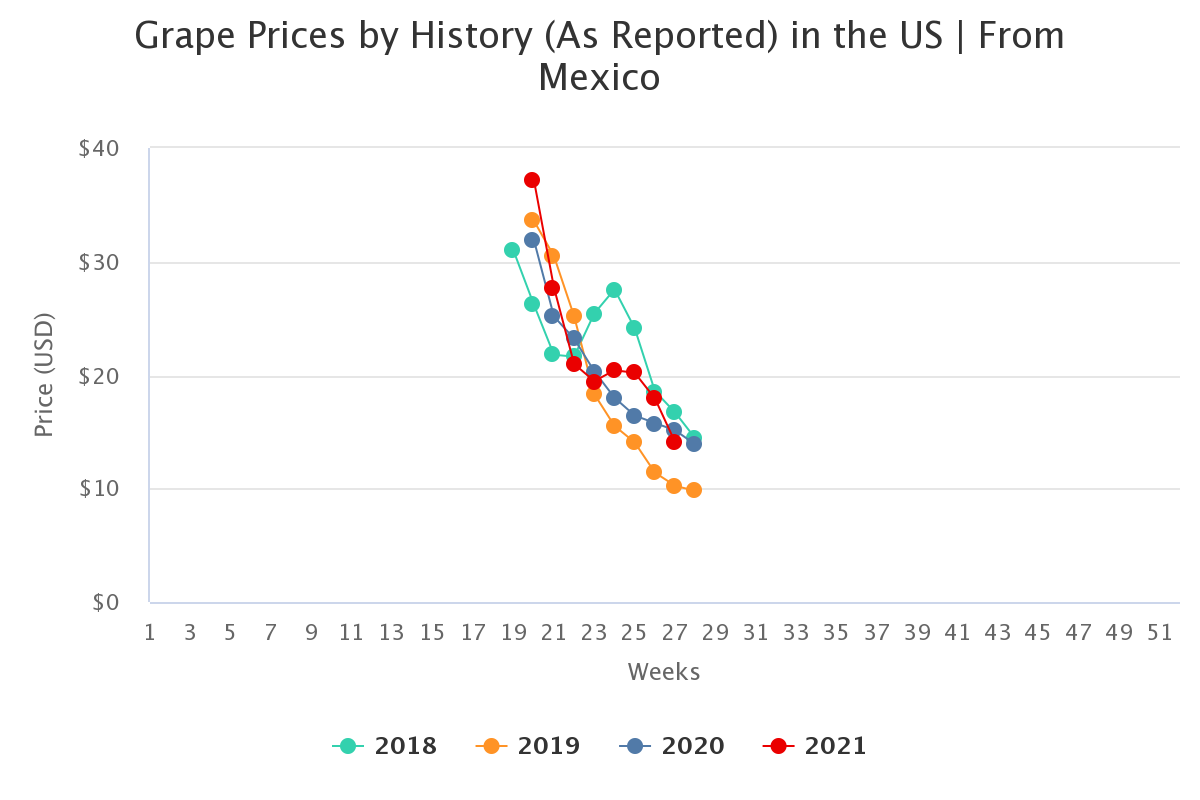
Source: USDA Market News via Agronometrics.
(Agronometrics users can view this chart with live updates here)
The Mexican Table Grapes Growers Association (AALPUM) has projected that the 2022 harvest will exceed 25 million boxes, a 19.5 percent increase compared to last year. The highest volume is projected for red seedless varieties at 46.9 percent, followed by white seedless varieties at 41.08 percent, then black seedless varieties at 5.97 percent and cotton candy at 4.70 percent. The first harvest is expected for the beginning of May, with the harvest picking up speed from May 15th onward. The early season should produce some 7.4 million boxes through May, followed by peak season with 16.59 million boxes in June. Finally the late season, in July, is expected to produce around 1.45 million boxes of table grapes.
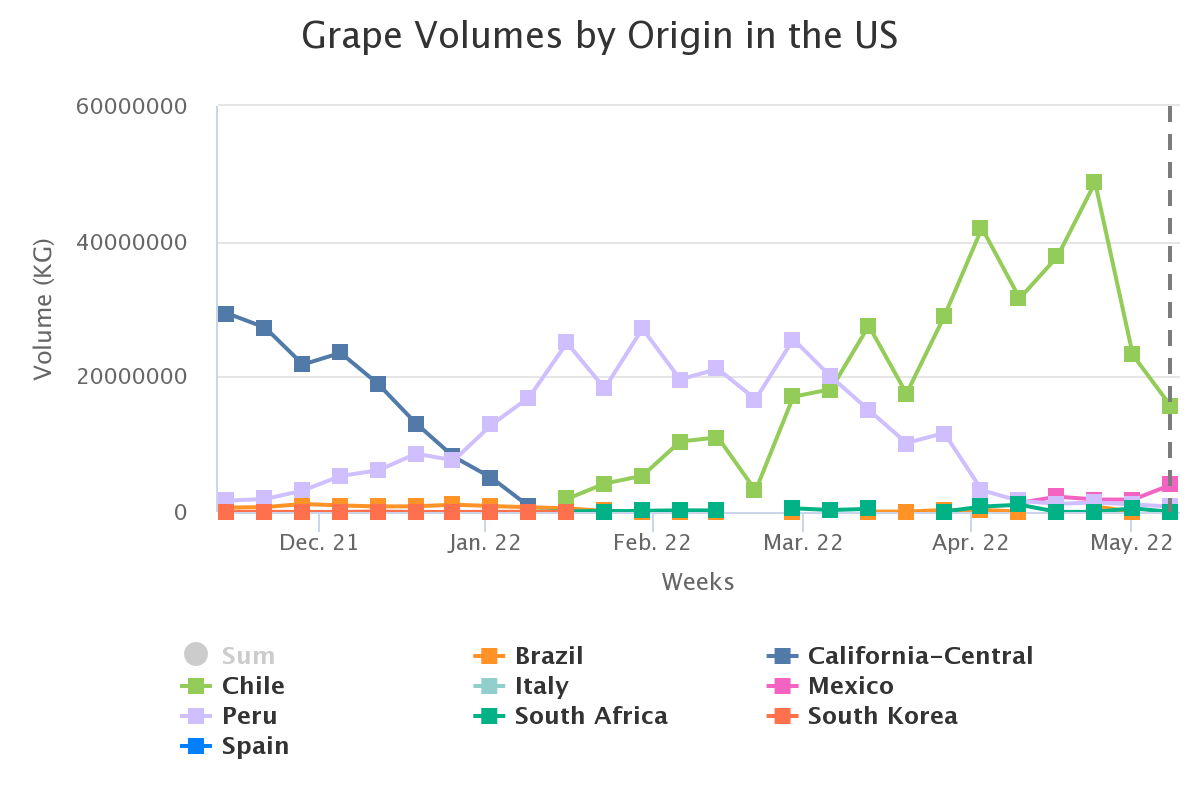
Source: USDA Market News via Agronometrics.
(Agronometrics users can view this chart with live updates here)
In our ‘In Charts’ series, we work to tell some of the stories that are moving the industry. Feel free to take a look at the other articles by clicking here.
All pricing for domestic US produce represents the spot market at Shipping Point (i.e. packing house/climate controlled warehouse, etc.). For imported fruit, the pricing data represents the spot market at Port of Entry.
You can keep track of the markets daily through Agronometrics, a data visualization tool built to help the industry make sense of the huge amounts of data that professionals need to access to make informed decisions. If you found the information and the charts from this article useful, feel free to visit us at www.agronometrics.com where you can easily access these same graphs, or explore the other 21 commodities we currently track.
Written by: Sarah Ilyas


