Raspberries in Charts: Record Mexican volumes send prices crashing
By
| 2 January 2020

The U.S. raspberry market has grown over the past few years, and the primary supplying regions remain Mexico and California.
As seen in the chart below, Mexico is responsible for the increase in volumes. The country surpassed California in 2015 as the leading supplier of raspberries. Later in this article, we will see how this increase in volume, particularly in recent months, has pushed down prices.
Historical volumes of raspberries in the U.S.
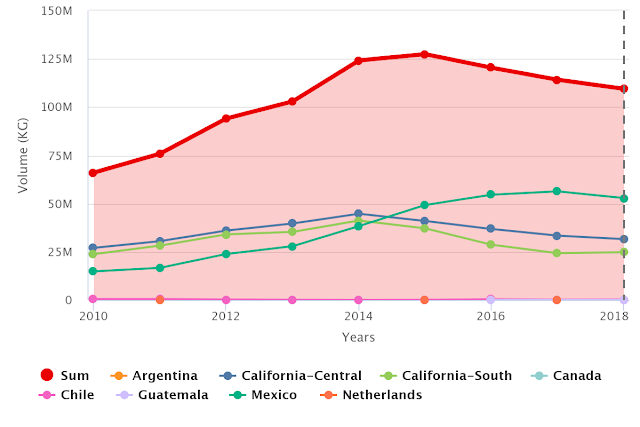
Source: USDA Market News via Agronometrics. (Agronometrics users can
view this chart with live updates here)
Relative to average prices, trends have been downward. A balance has been created in recent years where volumes have shown downward trends.
Historical prices of raspberries in the U.S.
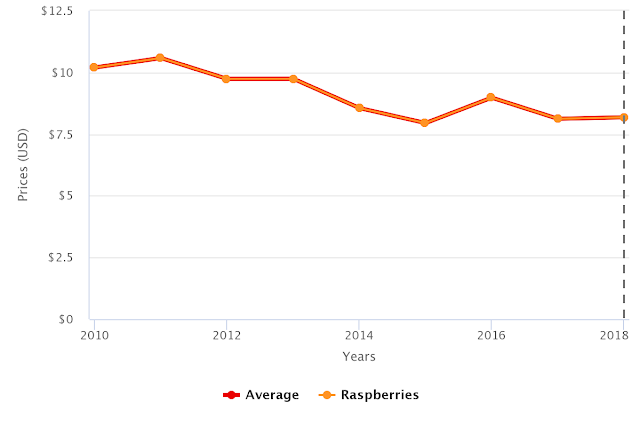
Source: USDA Market News via Agronometrics. (Agronometrics users can
view this chart with live updates here)
An increase in shipments from Mexico in recent years has driven the rise in the total volume of raspberries in the market.
In November of 2019, the country sent the highest volumes in the past five years to the U.S.
Historical monthly volume of Mexican raspberries in the U.S.
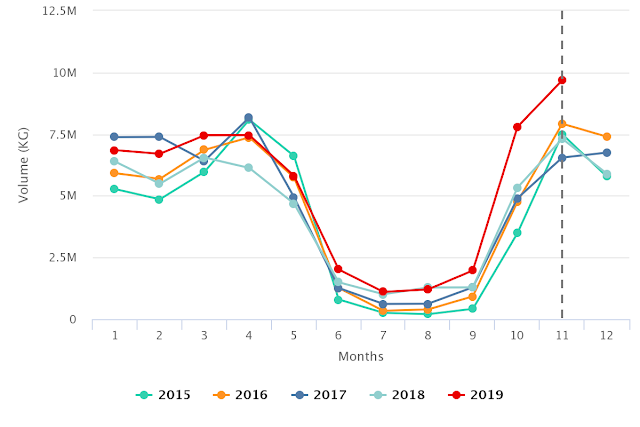
Source: USDA Market News via Agronometrics. (Agronometrics users can
view this chart with live updates here)
As a result, prices have fallen to their lowest level in five years. Looking forward, we will see if this U.S. market behavior will be sustainable over time.
Historical prices of raspberries in the U.S.
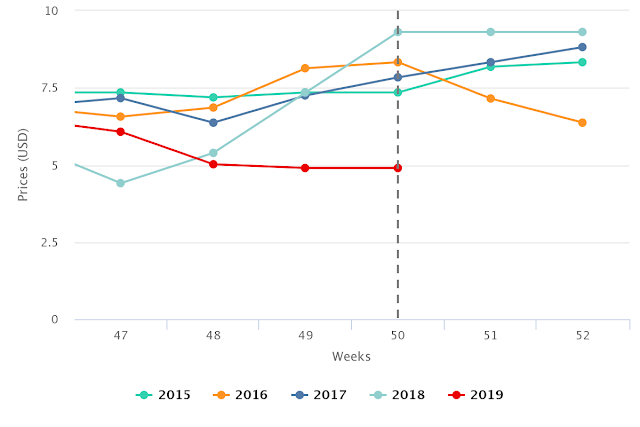
Source: USDA Market News via Agronometrics. (Agronometrics users can
view this chart with live updates here)
Written by: Cristian Crespo – Colin Fain
Original published in FreshFruitPortal.com on January 02, 2020 (Link)
Related Stories