
Peru was world’s second-largest table grape exporter in 2020 – industry body
From
| 11 August 2021

Overview of peruvian table grape exports, complemented by charts from Agronometrics. Original published on August 11, 2021.
Peru last year consolidated itself as the world’s second-largest table grape exporter, according to the country’s Association of Exporters (ADEX).”Thanks to the trade agreements signed and the work of businessmen and Senasa (the National Agricultural Health Service), grapes gained access to more markets and in 2020 Peru became the world’s second-largest exporter, after China,” said Lizbeth Pumasunco Rivera, Coordinator of Trade Intelligence at the CIEN-ADEX Global Business and Economics Research Center.
Last year China’s grape exports totaled US$1.21 billion, achieving a global export share of 14% and an increase of 24%, while Peru exported US$991 million, representing 11% and experiencing an increase of 22%, ADEX said.
Last year the world grape market amounted to US$10.2 billion, an increase of 6% over the previous year. The U.S. was the main world buyer with 19% of the total value, followed by the Netherlands with 8%, and Germany with 8%.
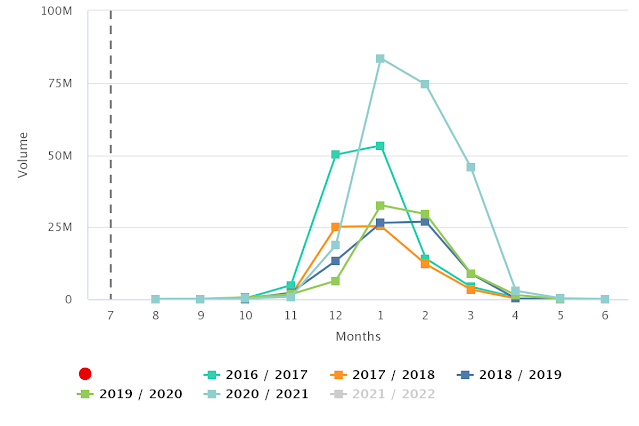
Volumes (Kg) of peruvian table grapes in the US Market

Source: USDA Market News via Agronometrics.
(Agronometrics users can view this chart with live updates here)
During the 2020-21 season, from October to March, Peru’s grape exports rose by 24 percent to $1.12 billion.
In November 2020 the USDA estimated that the country’s exports would only rise by 2 percent during the 2020-21 season.
Table grape exports continue to rise in the first half of 2021
The country’s grape exports have continued to grow rapidly this year. From January through June 2021, exports rose by 29 percent to US$522 million, ADEX said.
A little under half of these shipments were sent to the U.S., while the next most important destinations were Hong Kong, the Netherlands, Mexico and China.
The News in Charts is a collection of stories from the industry complemented by charts from Agronometrics to help better tell their story.
Access the original article with this (Link)
Related Stories


