Mangoes in Charts: With supply deficits expected over coming weeks, could prices double?
By
| 5 February 2019

With the industry reporting deficits in volume compared with last year (Peruvian mango exports to drop by more than a third, says industry rep and Mexican mango season to get underway with Ataulfo variety), here we take a look at the industry data available to gain insights over what might be in store.
The Virtual Graphs tool on the Mango Boards website does a great job of visualising the associations shipping projections against last years arrivals. Through the tool, which might look familiar given that it was built by Agronometrics, we can see a glaring hole in supply expected to span about eight weeks.
When looking at this data keep in mind that the shipping projections are volumes leaving their respective origins. As such there will be a delay before they arrive in the US.
US Mango Board Virtual Graphs
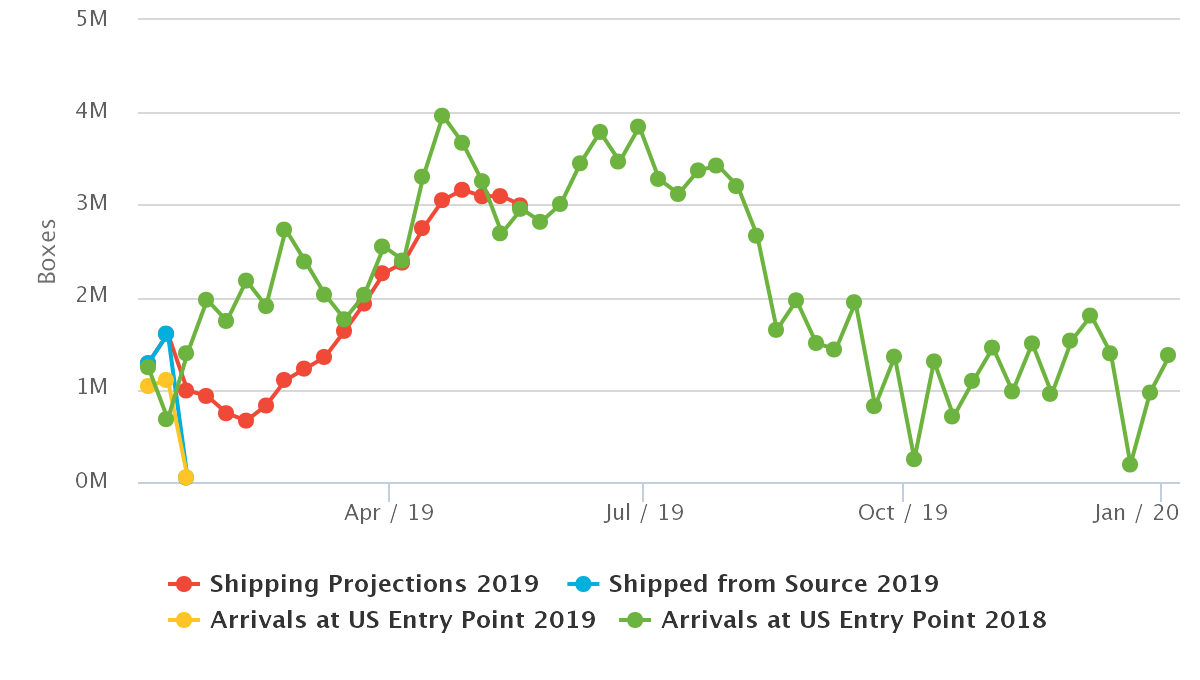
(Source: US Mango Board Virtual Graphs)
Looking at movements from last year, we can see that the producing regions most affected will be Peru and Mexico.
Mango Volumes by Origin 2018
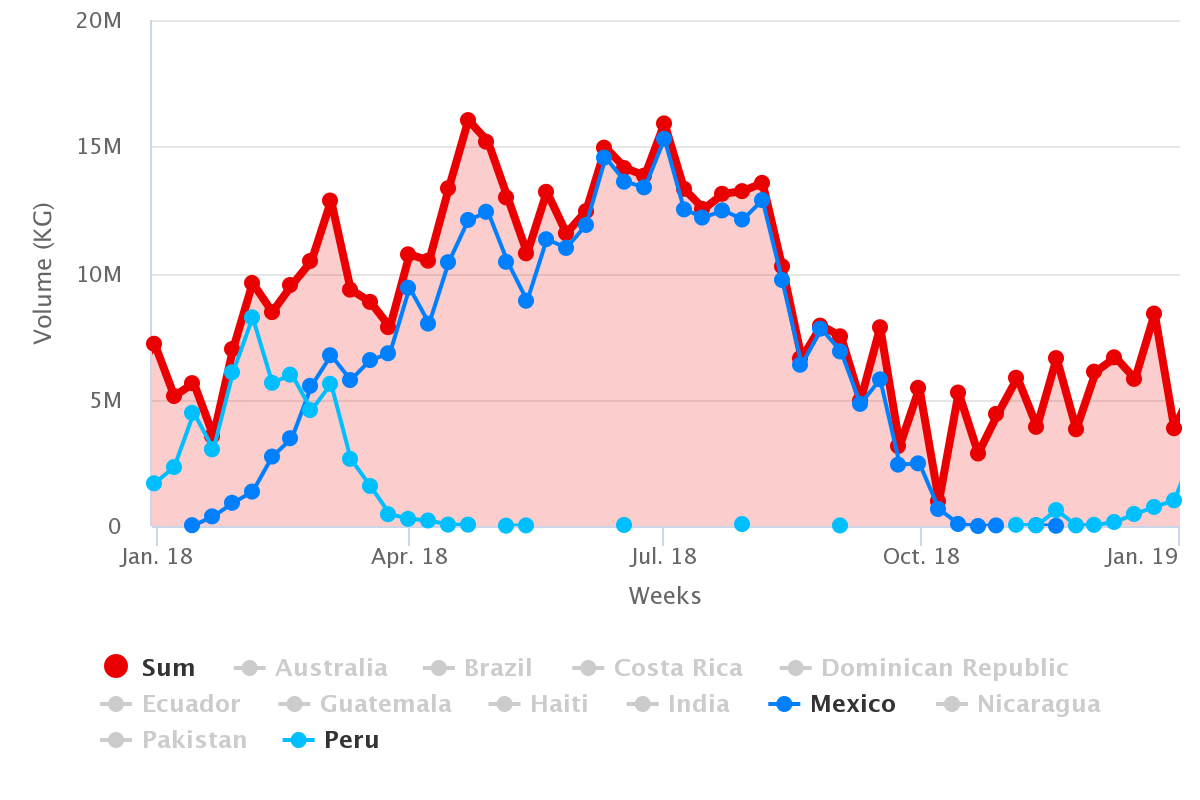
(Source: USDA Market News via Agronometrics)
[Agronometrics users can view this chart with live updates here]
To gain a bit of perspective I went back in time to see if there was a year that had a similar production level during this time period. However, the last four years haven’t had any events that are as dramatic as what are being expected, leaving us with 2015 as the closest example of a year with lower shipments.
Mango Historic Weekly Volumes
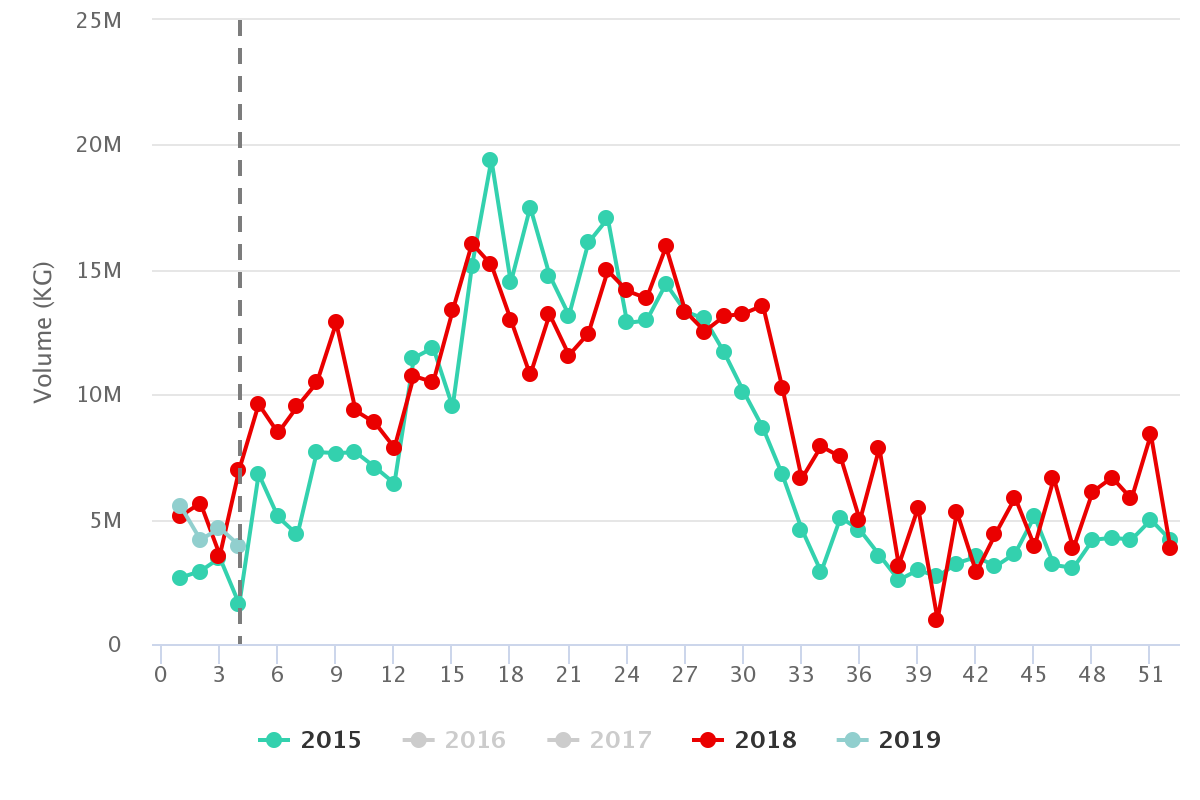
(Source: USDA Market News via Agronometrics)
[Agronometrics users can view this chart with live updates here]
With prices this year already coming in a full dollar over last, the question is how far could they yet go? 2015 data that is available is pretty interesting, hinting at the possibility of prices even being able to double. Although the mechanics of the how pricing is set are more complex than I can represent with this data, should the forecasts predicted actually play out, I wouldn’t be surprised if prices even surpassed what we saw in 2015.
Mango Historic Weekly Prices
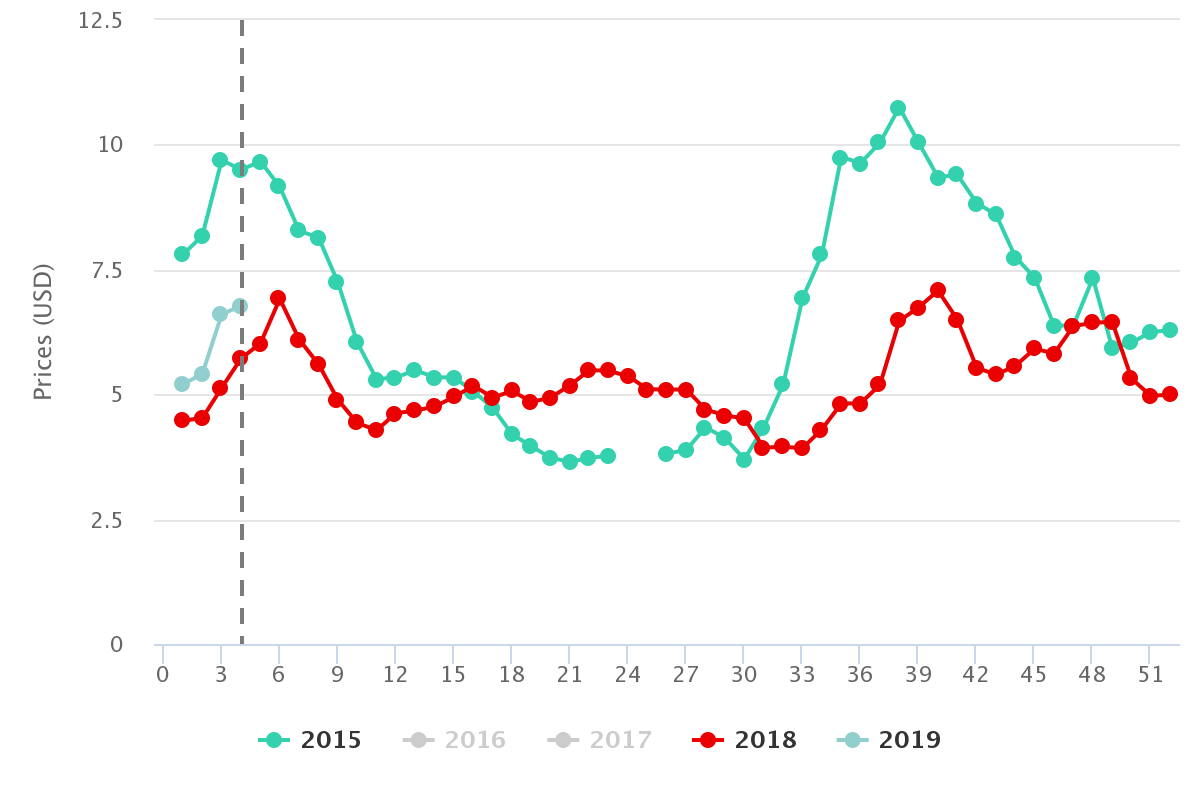
(Source: USDA Market News via Agronometrics)
[Agronometrics users can view this chart with live updates here]
As a useful tool for readers to gauge how the markets are currently evolving, we offer below weekly pricing by fruit size.
Mango Prices by Size, Variety Kent
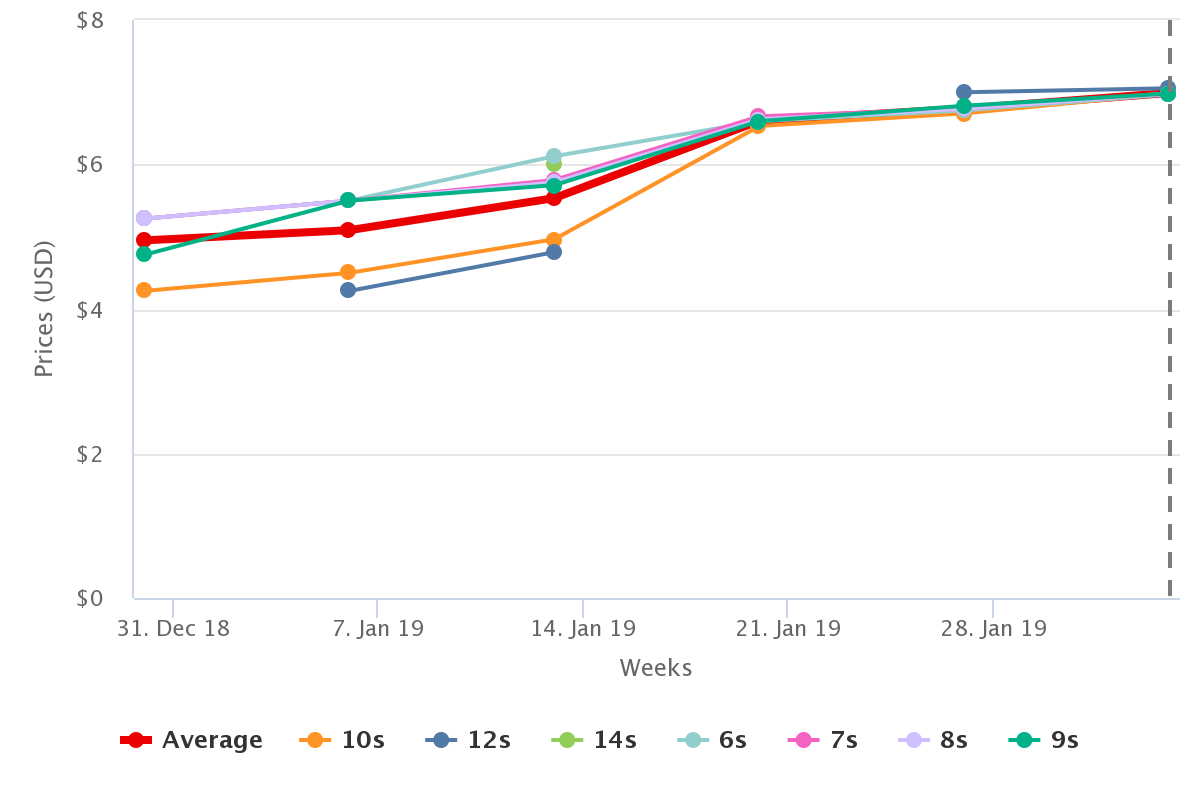
(Source: USDA Market News via Agronometrics)
[Agronometrics users can view this chart with live updates here]
[Agronometrics users can view this chart with live updates here]
Mango Prices by Size, Variety Kent (Week 5)
|
Sizes
|
Price Reported
|
|
Average
|
$6.99
|
|
6s
|
$6.97
|
|
7s
|
$6.98
|
|
8s
|
$6.98
|
|
9s
|
$6.98
|
|
10s
|
$6.98
|
|
12s
|
$7.06
|
Written by: Colin Fain
Original published in FreshFruitPortal.com on February 05, 2019 (Link)
Related Stories