Grapes in charts: U.S. market has seen flat volumes and falling prices
By
| 14 May 2019

I will start this article with the million-dollar question – is it sustainable for table grape growers to send fruit to a market which over the last decade has seen flat pricing despite constantly rising production costs?
There are five origins which have dominated the U.S. market over the last decade, in terms of volumes, which are Central California, Chile, Mexico, Peru and Southern California. Central California is the leading origin, with a relatively stable supply over the years, as can be observed below.
Historic table grape arrival volumes in the U.S., by origin
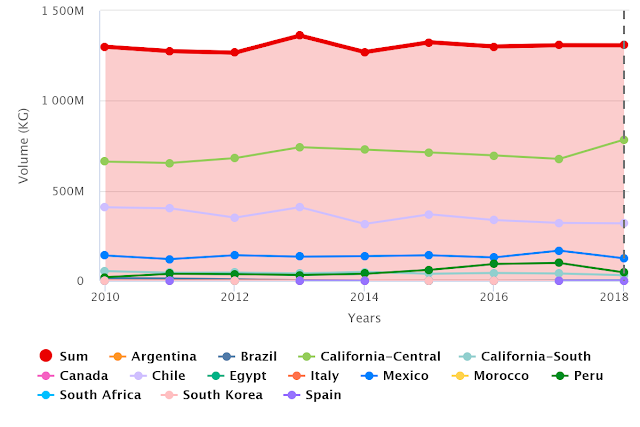
Source: USDA Market News via Agronometrics. (Agronometrics users can
view this chart with live updates here)
I wanted to show the following chart to illustrate the similarity between the different seasons in terms of grape volumes in the U.S. The volumes seem to be fairly flat over time (except for Central California in 2018), and of the same seasonality.
Historic table grape weekly arrival volumes in the U.S., by origin
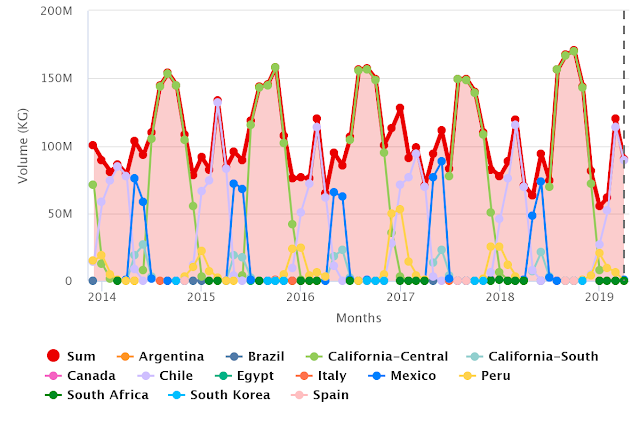
(Source: USDA Market News via Agronometrics. (Agronometrics users can
view this chart with live updates here)
The following chart shows us the annual shipment volumes and prices over the last five years. Shipments are similar year-by-year, as are the shipping dates, but prices have been falling over time, almost independently of the arrival volumes in the U.S. market.
Historic arrival volumes in the U.S. and average prices (USD/KG)
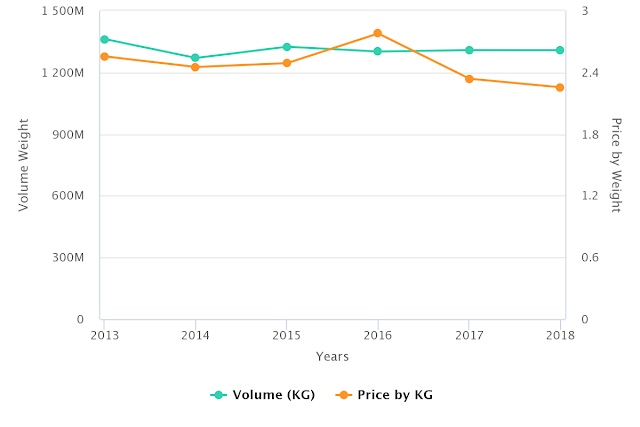
(Source: USDA Market News via Agronometrics. (Agronometrics users can
view this chart with live updates here)
Although historic USDA data tells us that table grape ‘arrival’ volumes have been stable over the last few years, 2018 was different due to the large supplies from California which led to a decline in grape prices.
Historic monthly volumes of table grapes in the U.S.
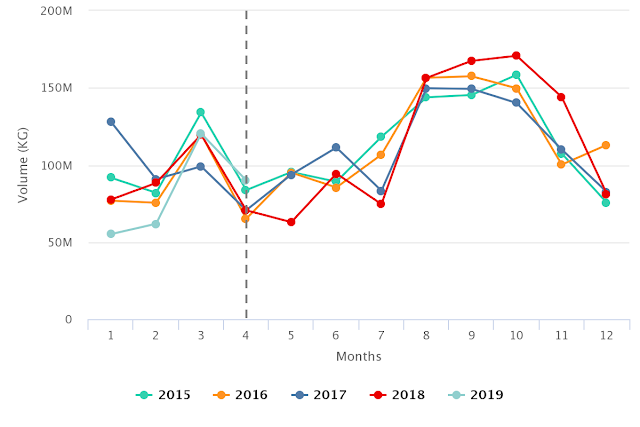
(Source: USDA Market News via Agronometrics. (Agronometrics users can
view this chart with live updates here)
Below we can see the average prices in 2018 in the U.S. market, which were the lowest in the last four years. They did, however, begin to recover during the start of 2019.
Historic arrival prices of grapes in the U.S. market
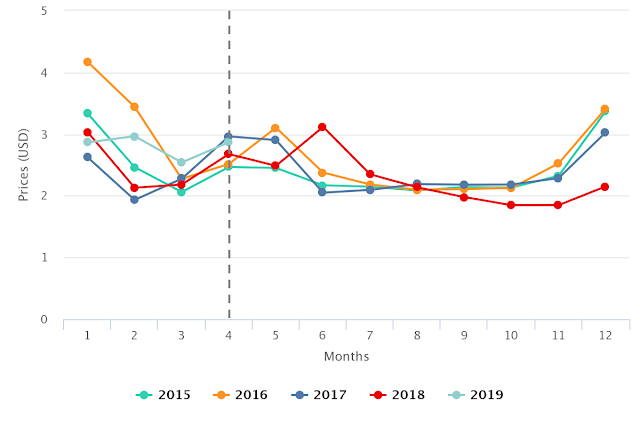
(Source: USDA Market News via Agronometrics. (Agronometrics users can
view this chart with live updates here)
The U.S. table grape market seems to have remained almost unchanged over the last few years. What must therefore happen to make the market more dynamic and attractive for growers? Or, conversely – what must growers do to generate greater profitability in their business?
This is a relatively flat market, both in terms of and volumes, which have remained almost the same, and prices, which have been falling slightly.
My conclusion is as follows: either maximize productivity with investments, varieties, and yields, or change the business you are involved with.
Written by: Cristian Crespo
Original published in FreshFruitPortal.com on May 14, 2019 (Link)
Related Stories