Grapes in Charts: Record California volumes reverse Chilean pricing trends
By
| 19 February 2019

During a very atypical season, table grape volumes have fallen dramatically over the last couple few weeks to usher in unusually high prices. In this article I’ll look at how Chile is developing, which will serve as a complement to my previous piece on the subject – Grapes in Charts: How will Chile’s expected crop affect U.S. market against backdrop of low prices?
Grape Prices and Volumes

(Source: USDA Market News via Agronometrics)
[Agronometrics users can view this chart with live updates here]
Although it is normal for prices to increase as volumes fall, what is strikingly abnormal about this season so far is how the pricing trends have gone completely against the normal trends, steadily rising throughout the Chilean Season as opposed to entering high and slowly falling as the season progresses.
Historic Grape Prices from Chile

(Source: USDA Market News via Agronometrics)
[Agronometrics users can view this chart with live updates here]
The cause of this backwardness in the market is an unusually strong production from California, whose market options were also limited by the tariffs imposed by China. As a consequence the U.S. market was flooded with fruit, building up inventories that still needed to be cleared even when Chile’s crop began arriving.
Historic Grape Volumes

(Source: USDA Market News via Agronometrics)
[Agronometrics users can view this chart with live updates here]
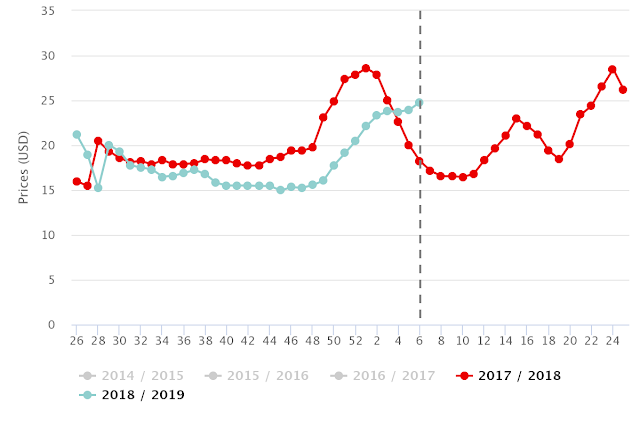
The resulting prices were the lowest we have seen in the last five years from week 39 right the way through week 2.
Historic Grape Prices

(Source: USDA Market News via Agronometrics)
[Agronometrics users can view this chart with live updates here]
Considering that Chile is expected to ship a similar amount to last year, I think that the outlook I published in the last article still holds, and we should see the market shift back to how it normally oper
ates over the next couple of weeks.
ates over the next couple of weeks.
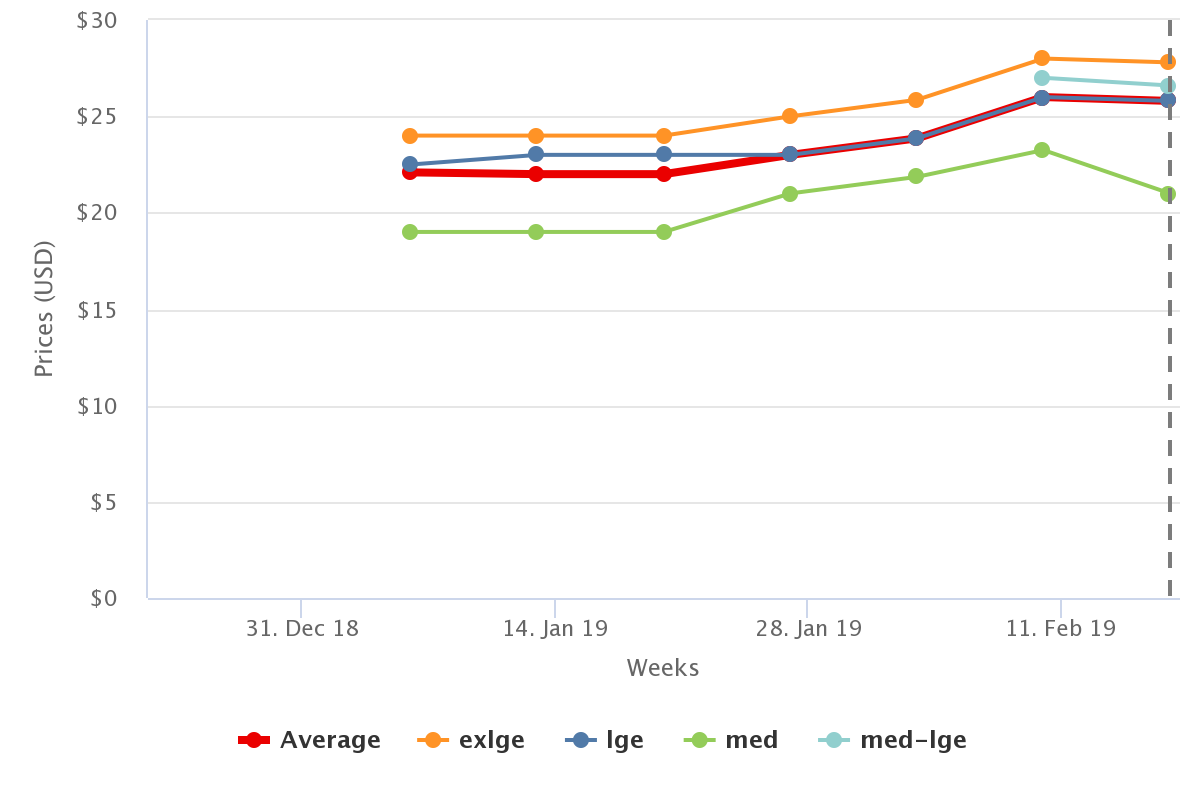
On a separate note, as a useful tool for readers to gauge how the markets are currently evolving, we offer weekly pricing by fruit size.
Red Seedless, Non-Organic, Prices by Size
(Source: USDA Market News via Agronometrics)
Red Seedless, Non-Organic, Prices by Size (Week 7)
|
Sizes
|
Price Reported
|
|
Average
|
$25.80
|
|
med
|
$21.00
|
|
med-large
|
$26.60
|
|
large
|
$25.80
|
|
extra-large
|
$27.80
|
Written by: Colin Fain
Original published in FreshFruitPortal.com on February 19, 2019 (Link)
Related Stories