Grapes in Charts: California sees low prices after Mexican supply surge
By
| 9 July 2019

South and Central California are currently kicking off their table grape harvest season, which typically runs from July 10 to Oct. 15. As such, now is the perfect time to review how the category’s volumes and prices have been behaving.
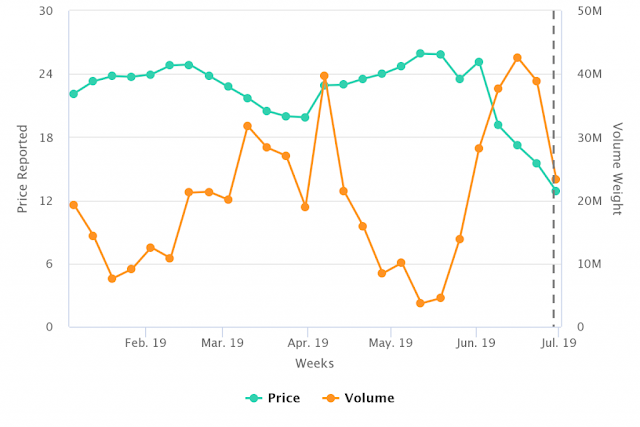
U.S. grape volumes and prices (non-organic)
Source: USDA Market News via Agronometrics. (Agronometrics users can
view this chart with live updates here)
In late May we began observing a steady climb in table grape volumes (in orange). While these peaked two weeks ago, they have remained above the 20-million-mark ever since.
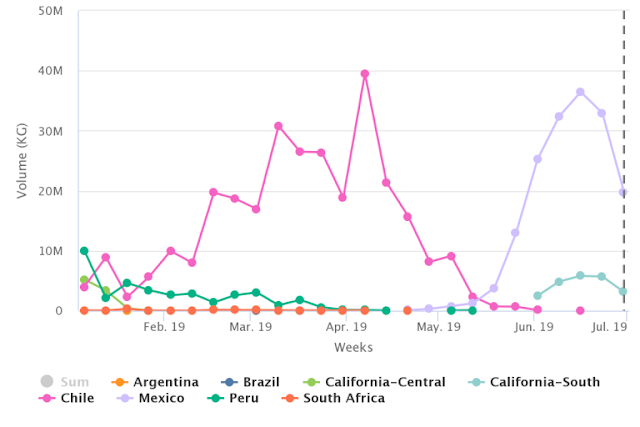
Looking at this year’s shipments by origin, we can see that once Chile’s production began finishing up, Mexico promptly started supplying the market.
2019 Table grapes’ weekly arrival volumes in the U.S. by origin (non-organic)
(Source: USDA Market News via Agronometrics. (Agronometrics users can
view this chart with live updates here)
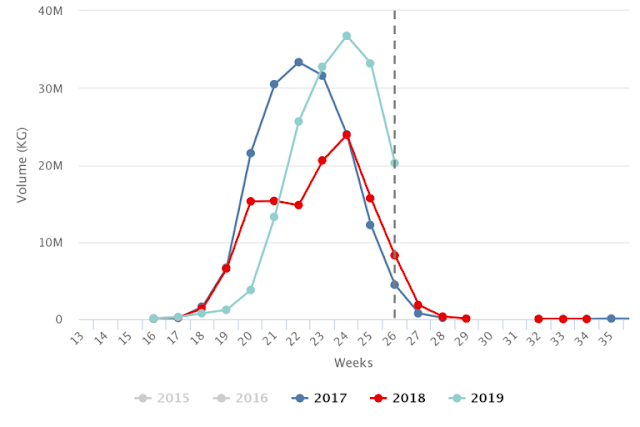
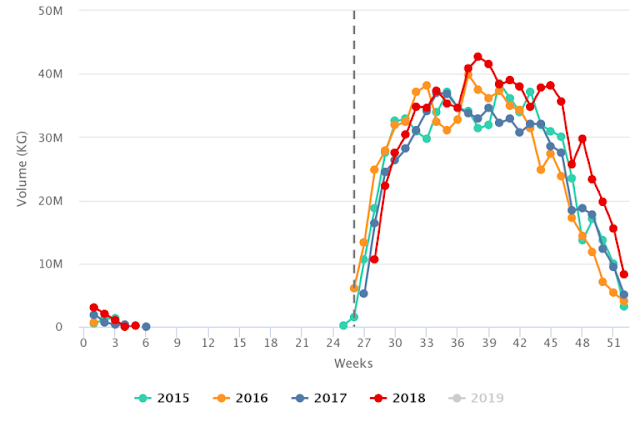
What’s more, Mexico has been supplying the market at an incredible rate. In fact, it has nearly doubled its weekly production volumes over last year’s.
Mexico’s table grapes’ volumes over last three seasons, (non-organic)
(Source: USDA Market News via Agronometrics. (Agronometrics users can
view this chart with live updates here)
Our article from early April predicted this boom in Mexican production. We also anticipated that the colder-than-usual temperatures in the country would lead to a delayed start to its season.
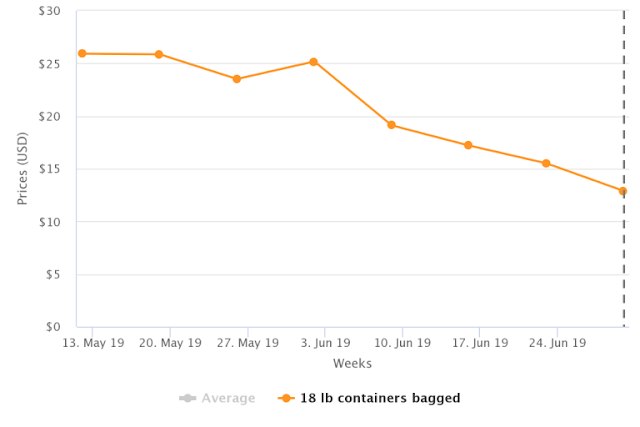
Due to these factors, we have seen a dramatic price drop of more than 50% in these past eight weeks, with a high of US$26.62 and a low of US$12.62 as seen in the following chart.
U.S. daily grape prices (non-organic)
(Source: USDA Market News via Agronometrics. (Agronometrics users can
view this chart with live updates here)
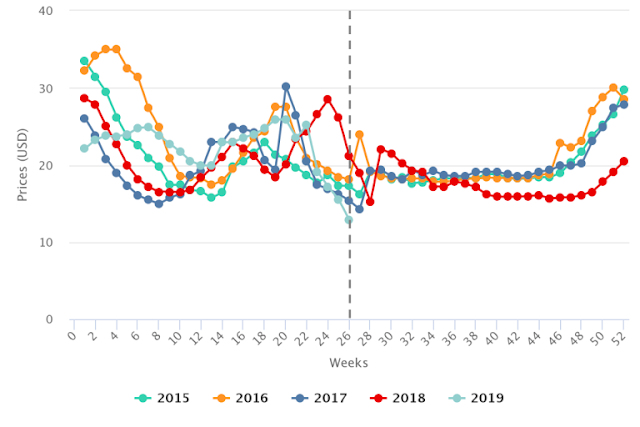
A sudden price drop is not atypical for the year’s 26-week half-way marker. However, with the vast volumes from Mexico saturating the market over the last couple of weeks, prices are significantly lower. Specifically, they have reached the lowest figure that we have seen in the past five years.
U.S. grapes’ historical prices, (non-organic)
(Source: USDA Market News via Agronometrics. (Agronometrics users can
view this chart with live updates here)
On the other side of the border, industry sources are expecting this year to be similar to last, which saw prices spike after a late start, followed by low-prices running from week 38 through the end of the year.
So although the market may see relief in the near future, the end of the year could see even more low prices to come.
Central California’s grape volumes, (non-organic)
(Source: USDA Market News via Agronometrics. (Agronometrics users can
view this chart with live updates here)
Written by: Colin Fain
Original published in FreshFruitPortal.com on July 09, 2019 (Link)
Related Stories