
Asparagus in Charts – See how the markets react as Mexicos volume more than doubles
By
| 8 January 2019

Today, I invite readers to dive into the world of the only vegetable we currently have in Agronometrics, Asparagus. In this article we will use Agronometrics to learn more about the Commodity.
The two biggest players are far and away Mexico and Peru. Both origins ship all year round, with their major peaks in production off setting each other to offers a relatively stable supply to consumers. There is a notable exception which is Mexico’s production during the first trimester of the year, which I explore in this article..
Asparagus Movements last 18 Months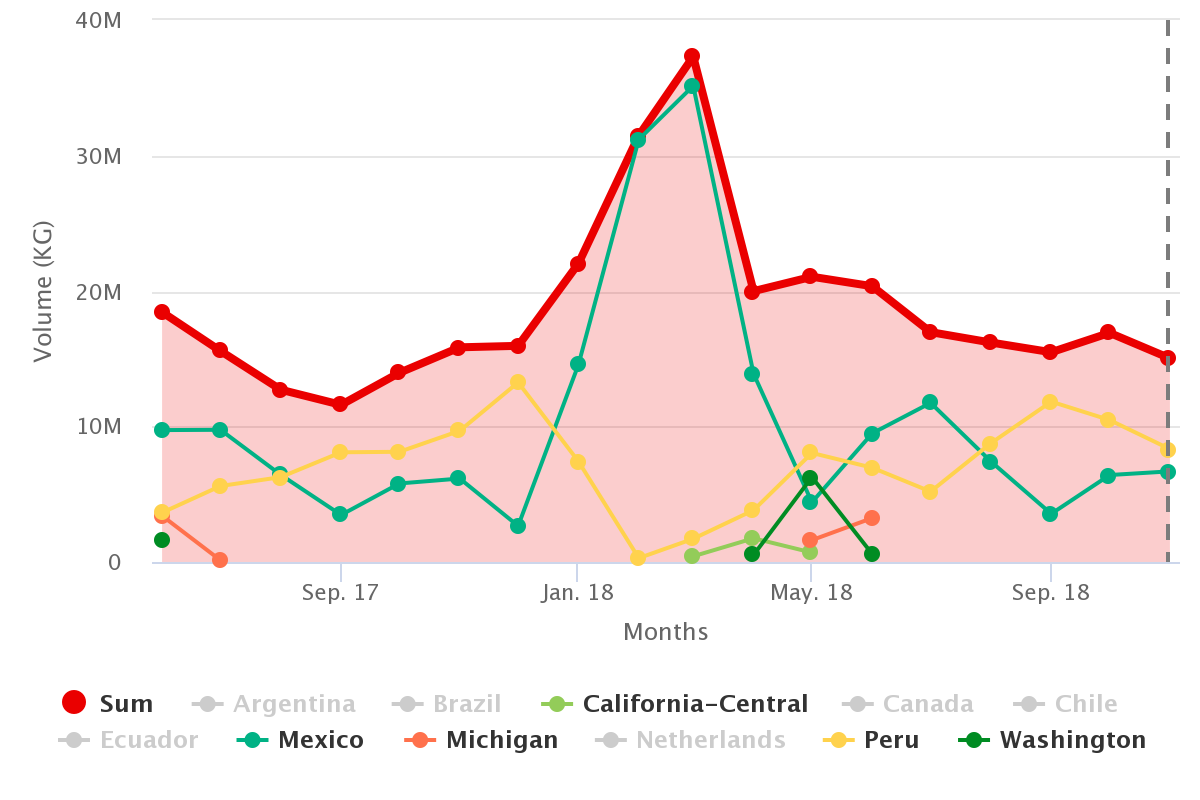
(Source: USDA Market News via Agronometrics)
[Agronometrics users can view this chart with live updates here]
(Source: USDA Market News via Agronometrics)
[Agronometrics users can view this chart with live updates here]
The market is characterized by volatility with considerable price swings seemingly every other month. Interestingly, Mexico seems to be the most volatile of the two big players in the Asparagus market dancing around Peru as it hits nearly all the spikes and troughs along the way.
Asparagus Prices by Origin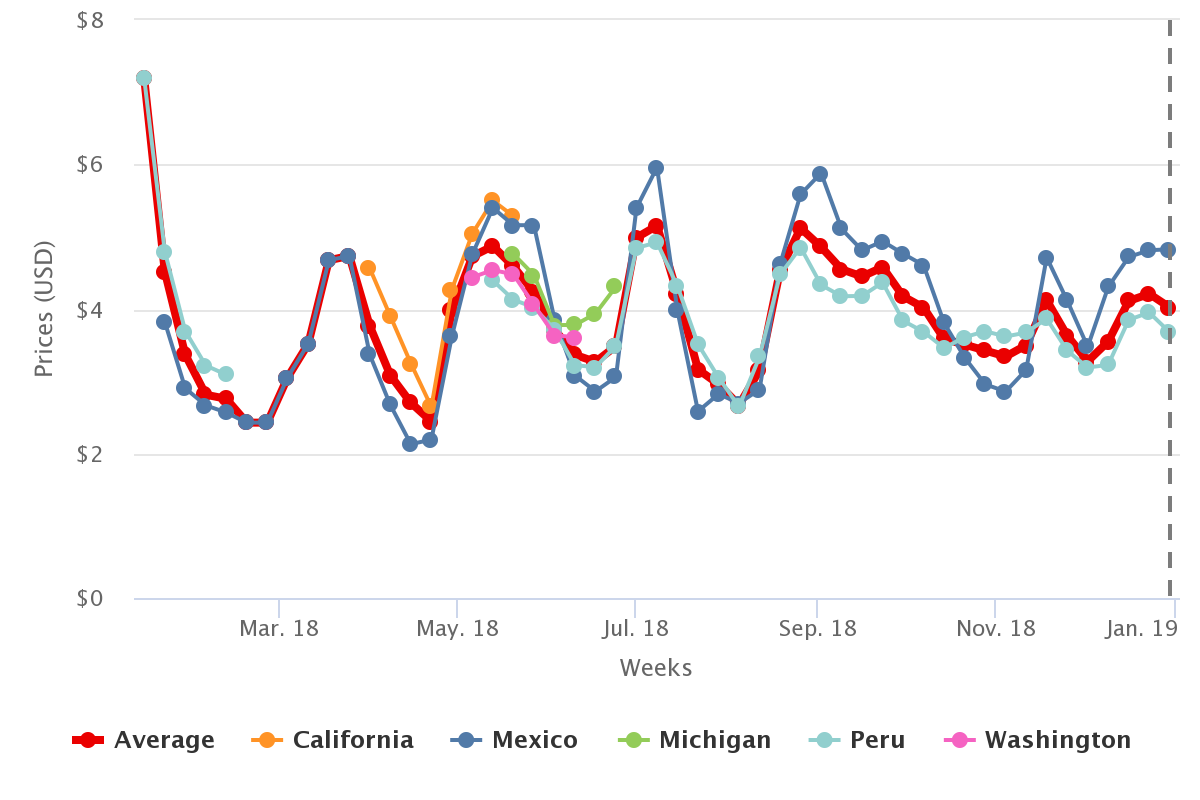
(Source: USDA Market News via Agronometrics)
[Agronometrics users can view this chart with live updates here]
(Source: USDA Market News via Agronometrics)
[Agronometrics users can view this chart with live updates here]
To make more sense of this information and to more easily spot long term trends, I would like to introduce our brand new tool with which to aggregate yearly volumes. In the chart below we can appreciate the massive growth the category has seen, breaking records year after year, more than doubling their production in the last 9 years. What is even more impressive, is that pricing has actually been doing a decent job at keeping up with the volumes, hitting a couples bumps along the way, but in the face of tremendous growth we even saw an increase of $0.24 per kilo last year compared to the previous year, an impressive achievement considering the on the 148M KG that were sent from Mexico to the US.
Average yearly prices and volumes of Asparagus from Mexico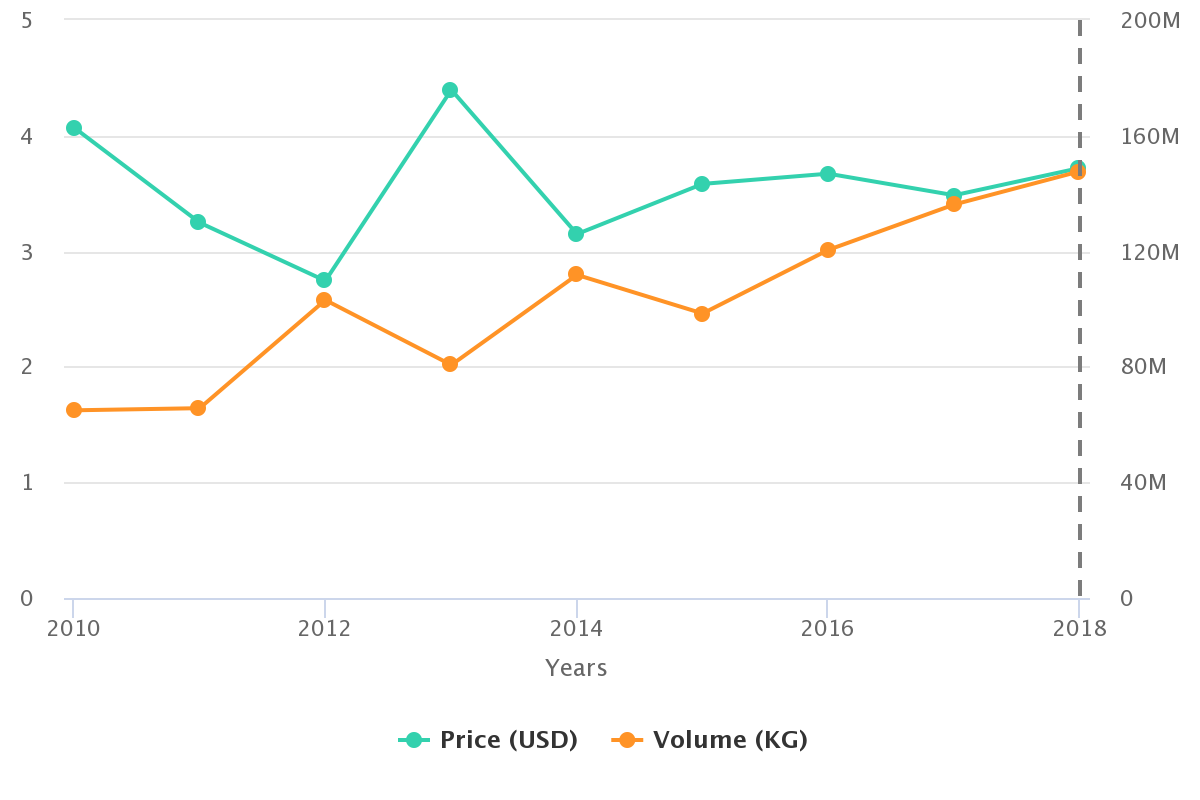
(Source: USDA Market News via Agronometrics)
[Agronometrics users can view this chart with live updates here]
(Source: USDA Market News via Agronometrics)
[Agronometrics users can view this chart with live updates here]
Written by: Colin Fain
Original published in FreshFruitPortal.com on January 08, 2019 (Link)
Related Stories


