
Agronometrics in Charts: The lessons in 20 years of U.S. grape market data
By
| 19 October 2021

Looking back on two decades of grape market data in the U.S. market can reveal quite a bit about how the category has developed, where it is today and where it could be headed.Our analysis begins with a look at the spot-market pricing data of the category, which until 2013 saw an impressive increase to USD $2.61/Kg.
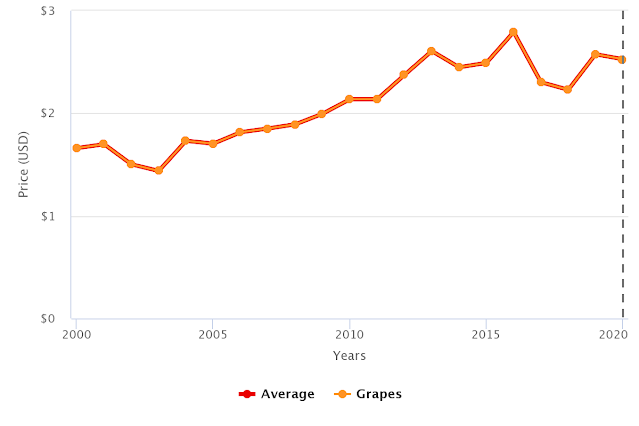
The trend behind this increase comes to life when comparing with 2005, since which time the industry has seen a steady increase in prices, with little variance, growing at a rate of 5% per year from a base of USD $1.70/Kg.
Since 2013, however, the consistent growth has not been observed. Using linear regression on the average prices between 2014 and 2020, we measure a level of growth that for all intents and purposes is flat.
Price of Grapes over the last 20 Years | Conventional (USD/Kg)
Source: USDA Market News via Agronometrics.
(Agronometrics users can view this chart with live updates here)
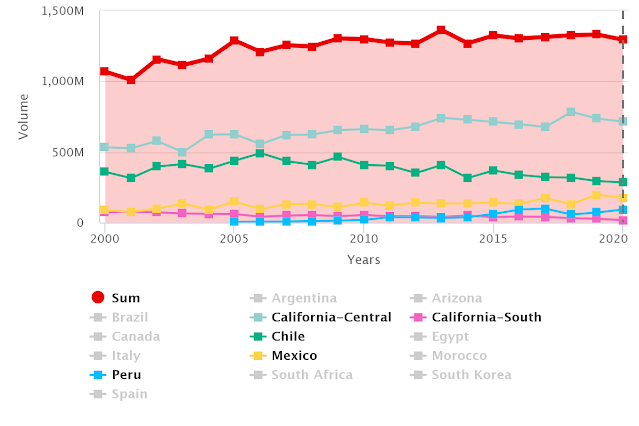
Over this same time period, volumes have remained relatively stable. From 2005 to 2013 the market grew by an average rate of 0.7% a year.
In 2013, Central California reached its highest production rate up to that point and the second-largest harvest on record. Like with prices, growth for the market as a whole slowed after that point, increasing by only 0.3% a year from 2014 to 2020.
Volume of Grapes by Origin over the last 20 Years | (Kg)
Source: USDA Market News via Agronometrics.
(Agronometrics users can view this chart with live updates here)
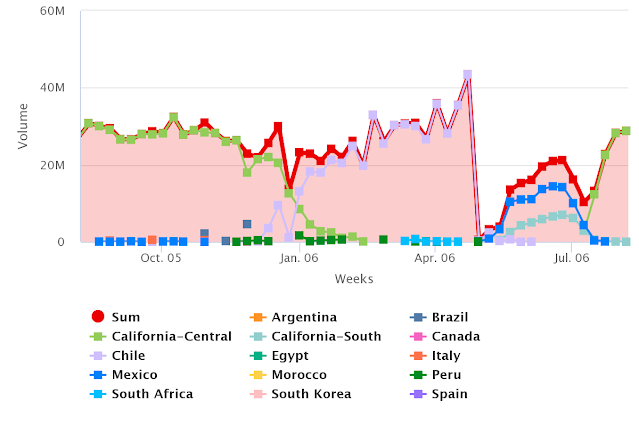
To keep these stable rates of growth, origins that have increased their production have been displacing existing suppliers. 2006 marked a turning point for the industry, with Chile reaching a market share of 40% after which the origin began a steady decline bringing it to a market share of 21% in 2020.
Where Chile used to own the entire window between the US and Mexico, Peru has replaced its early season production. A similar situation can be seen with growth from Mexico displacing Southern California’s production.
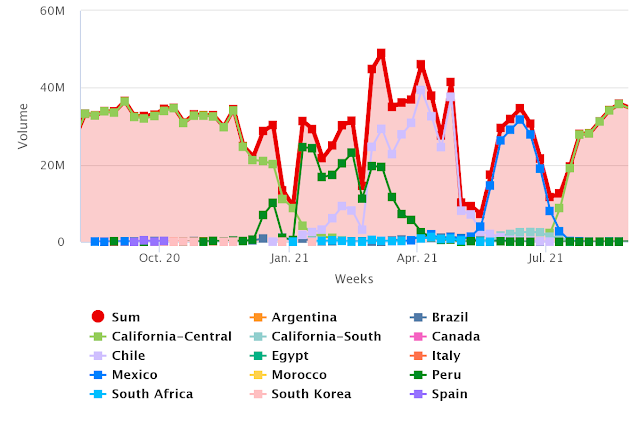
Volume of Grapes by Origin 2006 vs 2021 | (Kg)
Source: USDA Market News via Agronometrics.
(Agronometrics users can view this chart with live updates here)
The duality of stable volumes against the increasing prices we saw from 2005 to 2013 signifies an increase in demand for the commodity. Since 2013, however, growth in prices has also stabilized along with volumes indicating a stabilization of demand as well.
This isn’t to say that there hasn’t been growth, but among stable volumes anything new is replacing less competitive options.
The USDA makes limited data on
varieties in volumes available. What they do have is principally from Mexico and Southern California – admittedly a very limited window.
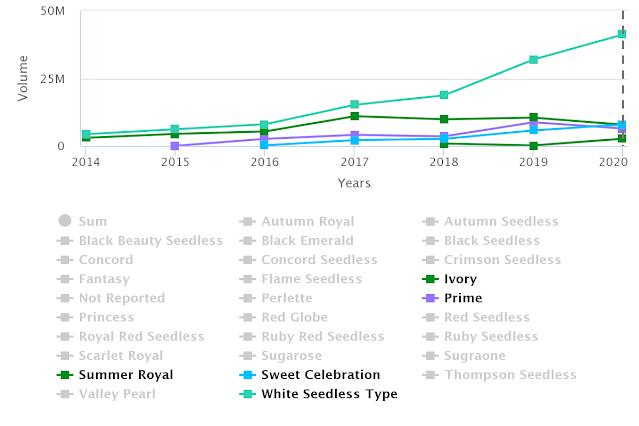
However, from this data we are able to observe the varieties which are growing the fastest which are led by White Seedless and include Summer Royal, Sweet Celebration, Prime and Ivory.
Volume of Grapes by Variety with Highest Growth | (Kg)
Source: USDA Market News via Agronometrics.
(Agronometrics users can view this chart with live updates here)
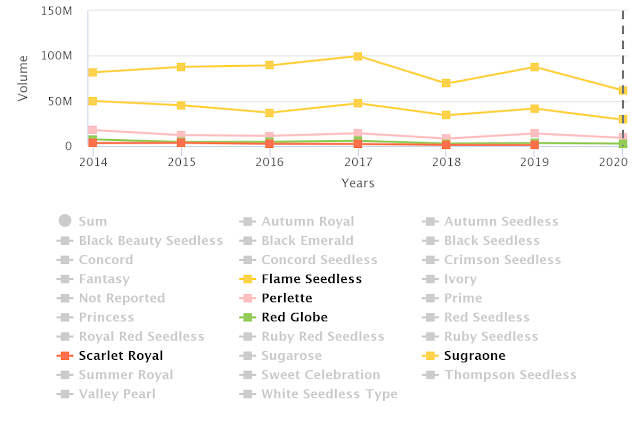
The other side of the coin shows the varieties from the origins mentioned that are losing market share which include Flame Seedless, Sugarone, Perlette, Red Globe and Scarlet Royal.
Volume of Grapes by Variety with Least Growth | (Kg)
Source: USDA Market News via Agronometrics.
(Agronometrics users can view this chart with live updates here)
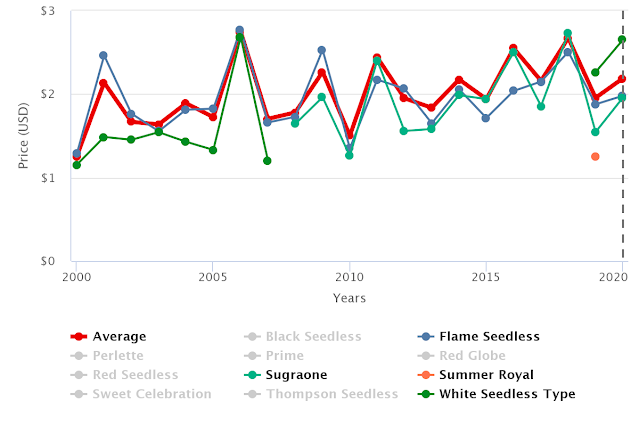
Although pricing on varieties is available for all origins, in order to keep our observations relevant to the volume data presented above the information being presented below is from Mexico. Interestingly, the categories that are showing the most growth offer the least amount of pricing information available.
This can be for several reasons, among them it can be that all the newer fruit is predestined directly for program, or there is not enough transaction for the USDA to report on what they consider a “market”.
What we can see is that the latest data available on White Seedless is outperforming the market average considerably, while the varieties that are seeing the largest decreases are consistently underperforming the market average.
Summer Royal seems like a bit of an oddity, but in its defence the data available for 2019 came in right a the end of the season when prices are the lowest and on most weeks it did perform better than Flames or Sugarone.
Price of Grapes by Variety from Mexico | Conventional (USD/Kg)
Source: USDA Market News via Agronometrics.
(Agronometrics users can view this chart with live updates here)
From all of this there are two conclusions that can be drawn. In a stable market new production with a competitive advantage that can outperform existing production is replacing it. Growth appears to be centered on the best performing fruit.
As a general rule in business the companies that are able to outperform their competition will be the most successful. Even where newer sources of income are limited, the companies that are able to produce the most efficiently will outperform their competition… so sharpen those pencils.
Written by: Colin Fain
Original published in FreshFruitPortal.com on October 19, 2021 (Link)


